
A value de-duplicated cache - 1
Analyzing heap memory with Eclipse MAT

Before we get into the details of Cache or anything for that matter, lets see why this article exists in the first place. Let’s talk about what problem are we trying to solve here.
OOM errors and Heap dumps
The situation here is with a standard Java TomCat service processing sync and async API requests and doing certain processing and responding back with the response. With occasional heap-dumps due to OOM errors. (You can enable heap dumps on out of memory with -XX:+HeapDumpOnOutOfMemoryError as JVM arg.)
OutOfMemory errors come when the JVM is not able to allocate required space, as there is none left in the heap space.
The obvious way to fix it, is to assign larger heaps. But the problem with that is it might cost a lot depending on how many servers you have, and what if the heap is still not enough?
The other way to fix it, is by ignoring it. Please don’t do it. And if you do, make sure to remove the JVM arg XX:+HeapDumpOnOutOfMemoryError as that will clutter the server host with so many .hprof files and eventually the server will run out of Disk space. (This reminds us to have alarms on disk usage.)
So, if we aren’t doing any of the above : using larger heap or ignoring it, then we are left with ‘fixing it’ as real engineers. And in order to do that, we need to analyze the heap dump files.
Analyzing heap dump files
We can use the wonderful Eclipse MAT to analyze our .hprof files. Open them up, and lets see what things are eating up the most memory.

Interesting, about 3 GB of the memory is taken up by a single ProxyClass instance ! And, what exactly is that proxy class?
(If you don’t know what is a proxy class, read it here, and here.)
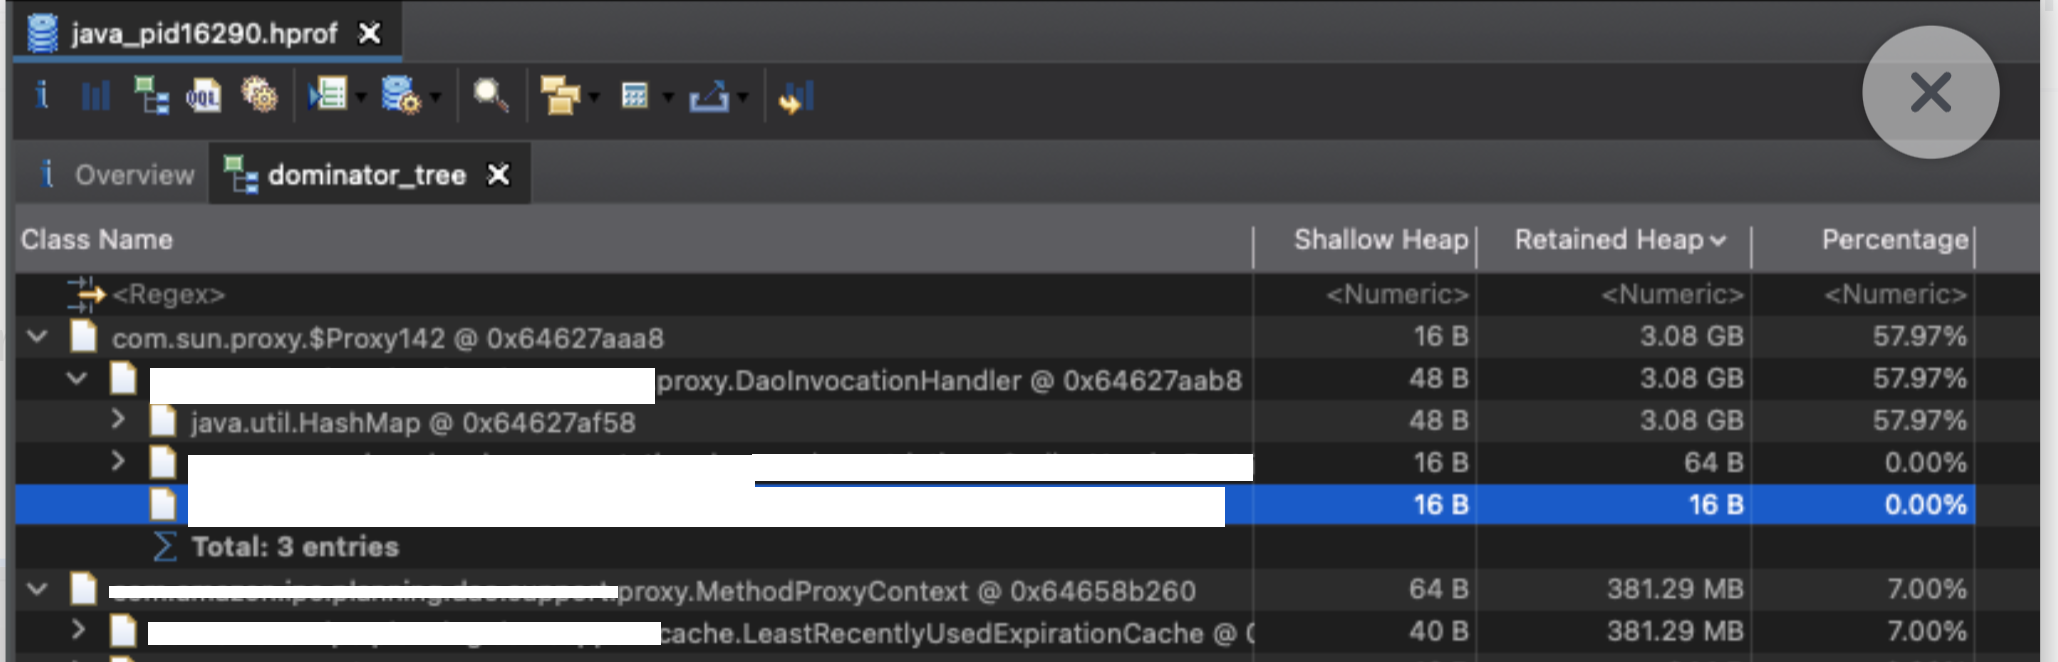
So, essentially the proxy class is generated through AOP which implements a Cache over a method. And the cache is a LinkedHashMap used as an LRU.
Looking at the contents of the cache:

This is even more interesting. Most of the values in the Map are showing up as the same size. This maybe a normal case if data are kind of well-defined with fixed size packets. But the service doesn’t work with any such thing and its purely business data which are almost never standardized as fixed size.
Looking deeper at a few values (not shown here), we can conclude that they all have the same data. Of course we can manually check all of those, but a good sample size test would also work here to get some confidence.
Essentially, we are looking at a HashMap with many different keys, but having the same value, which consumes 55% of memory and 3 GBs and results in frequent OOM errors.
In the next article, we will see where the duplicate data are coming from and what can we do about it.